Explanation vs Attention: A Two-Player Game to Obtain Attention for VQA

Abstract:
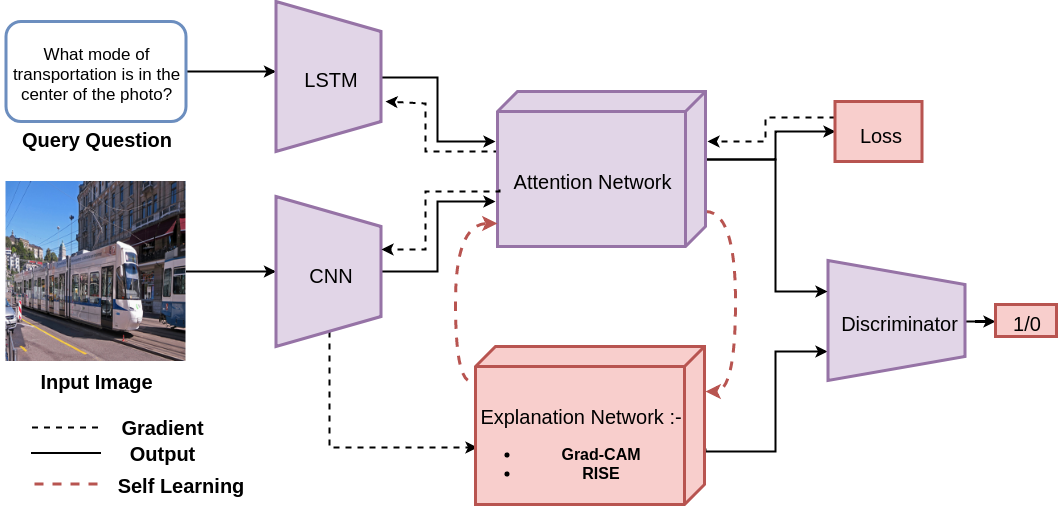
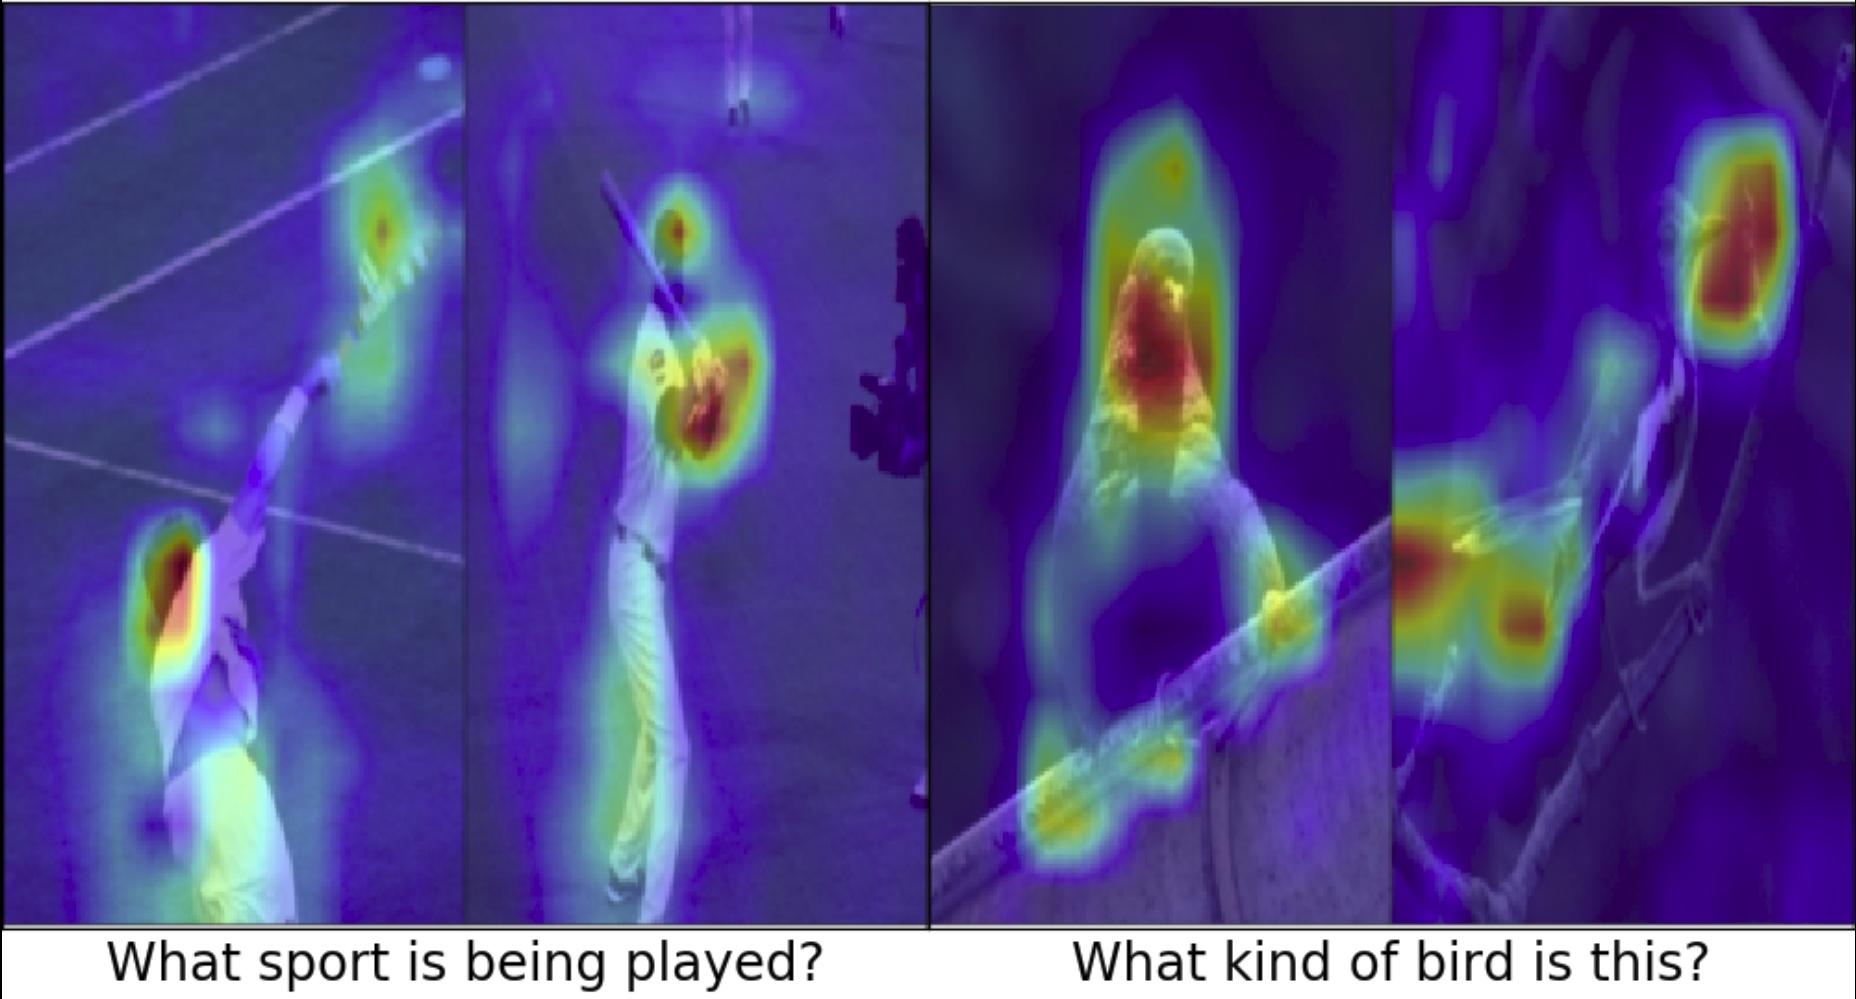
This figure shows improvement of the Attention mask and Explanation mask (Grad-CAM) using self supervised manner.
In this paper, we aim to obtain improved attention for a visual question answering (VQA) task. It is challenging to provide supervision for attention. An observation we make is that visual explanations as obtained through class activation mappings (specifically Grad-CAM) that are meant to explain the performance of various networks could form a means of supervision. However, as the distributions of attention maps and that of Grad-CAMs differ, it would not be suitable to directly use these as a form of supervision. Rather, we propose the use of a discriminator that aims to distinguish samples of visual explanation and attention maps. The use of adversarial training of the attention regions as a two-player game between attention and explanation serves to bring the distributions of attention maps and visual explanations closer. Significantly, we observe that providing such a means of supervision also results in attention maps that are more closely related to human attention resulting in a substantial improvement over baseline stacked attention network (SAN) models. It also results in a good improvement in rank correlation metric on the VQA task. This method can also be combined with recent MCB based methods and results in consistent improvement. We also provide comparisons with other means for learning distributions such as based on Correlation Alignment (Coral), Maximum Mean Discrepancy (MMD) and Mean Square Error (MSE) losses and observe that the adversarial loss outperforms the other forms of learning the attention maps. Visualization of the results also confirms our hypothesis that attention maps improve using this form of supervision.
PAAN Model:
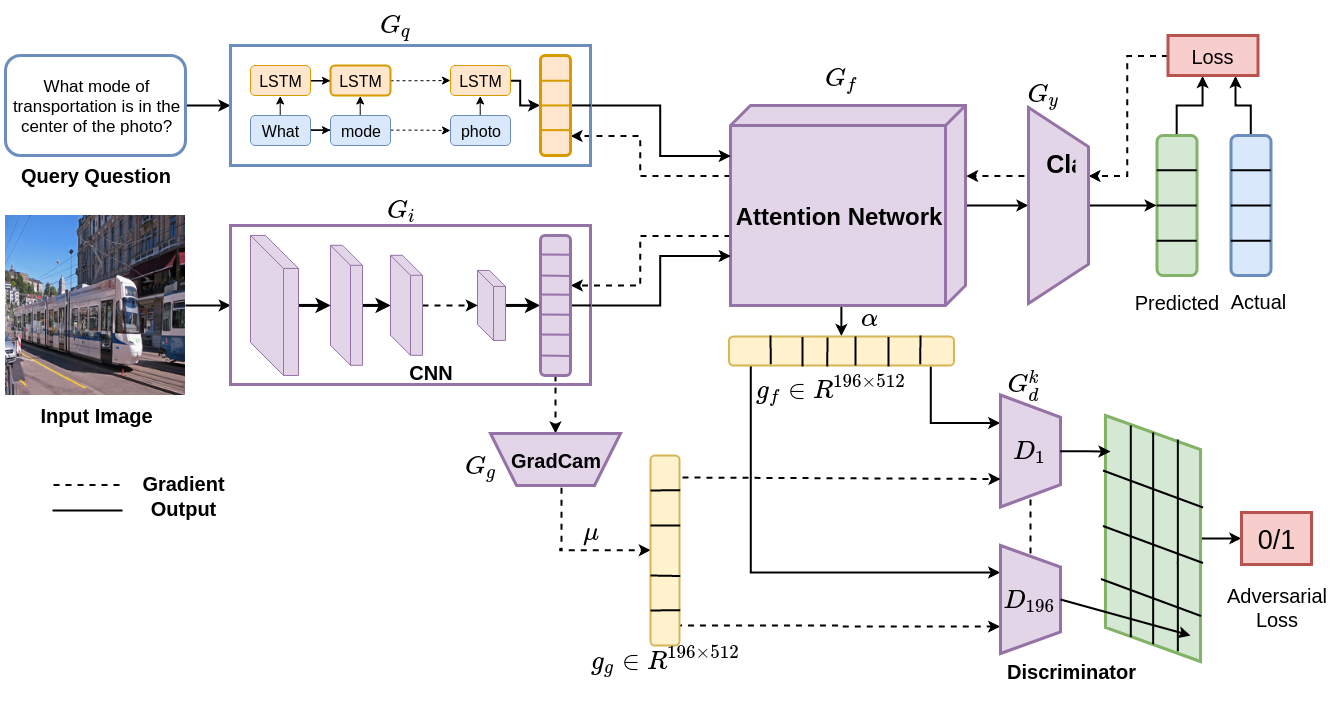
Illustration of model PAAN and its attention mask. Image feature and question feature are obtained using CNN and LSTM respectively. Attention mask is then obtained using these features and classification of the answer is done based on the attended feature. We have improved the attention mask with the visual explanation approaches based on Grad-CAM.
Some example of visual question answering using our method:
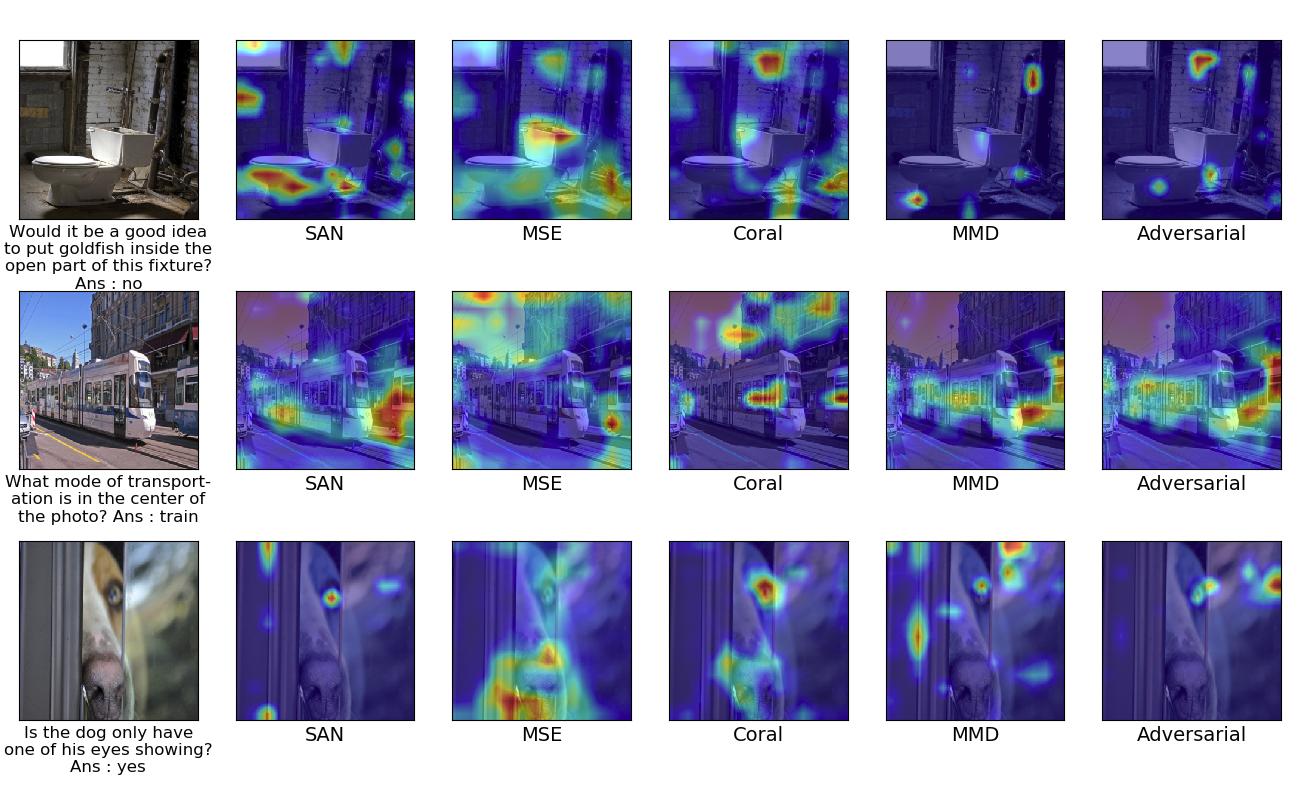
Attention Visualisation Results:
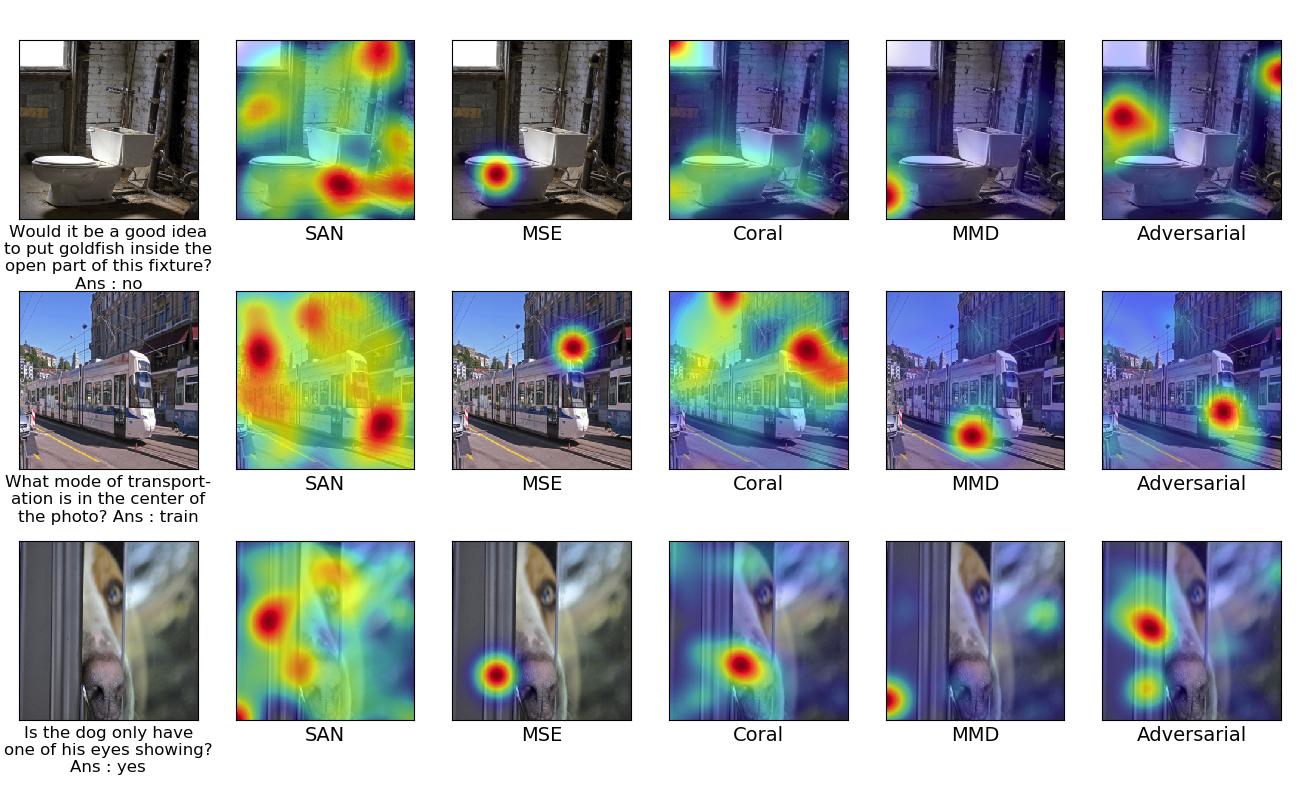
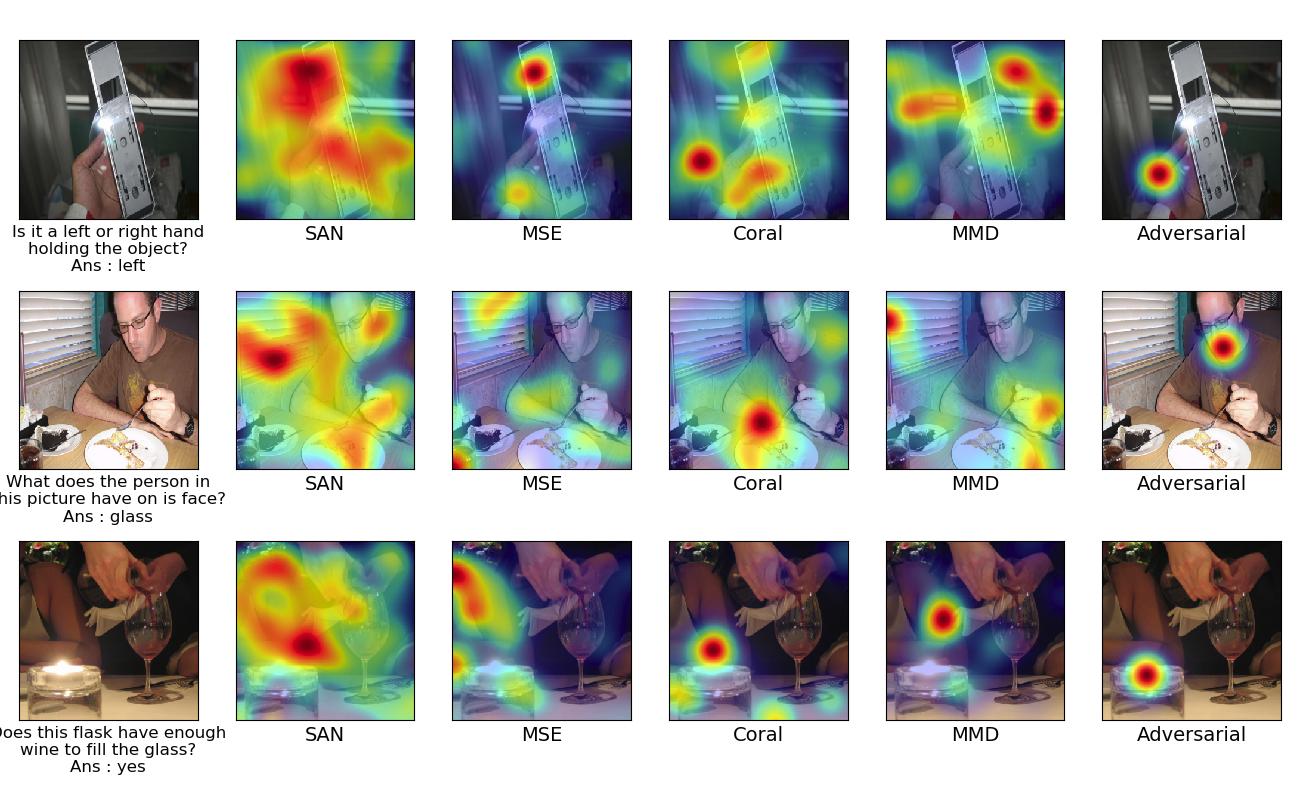
Examples with different approaches in each column for improving attention using explanation in a self supervised manner. The first column indicates the given target image and its question and answer. Starting from second column, it indicates the Attention map for Stack Attention Network, MSE based approach, Coral based approach, MMD based approach, Adversarial based approach respectively.
Explanation Visualisation Results:
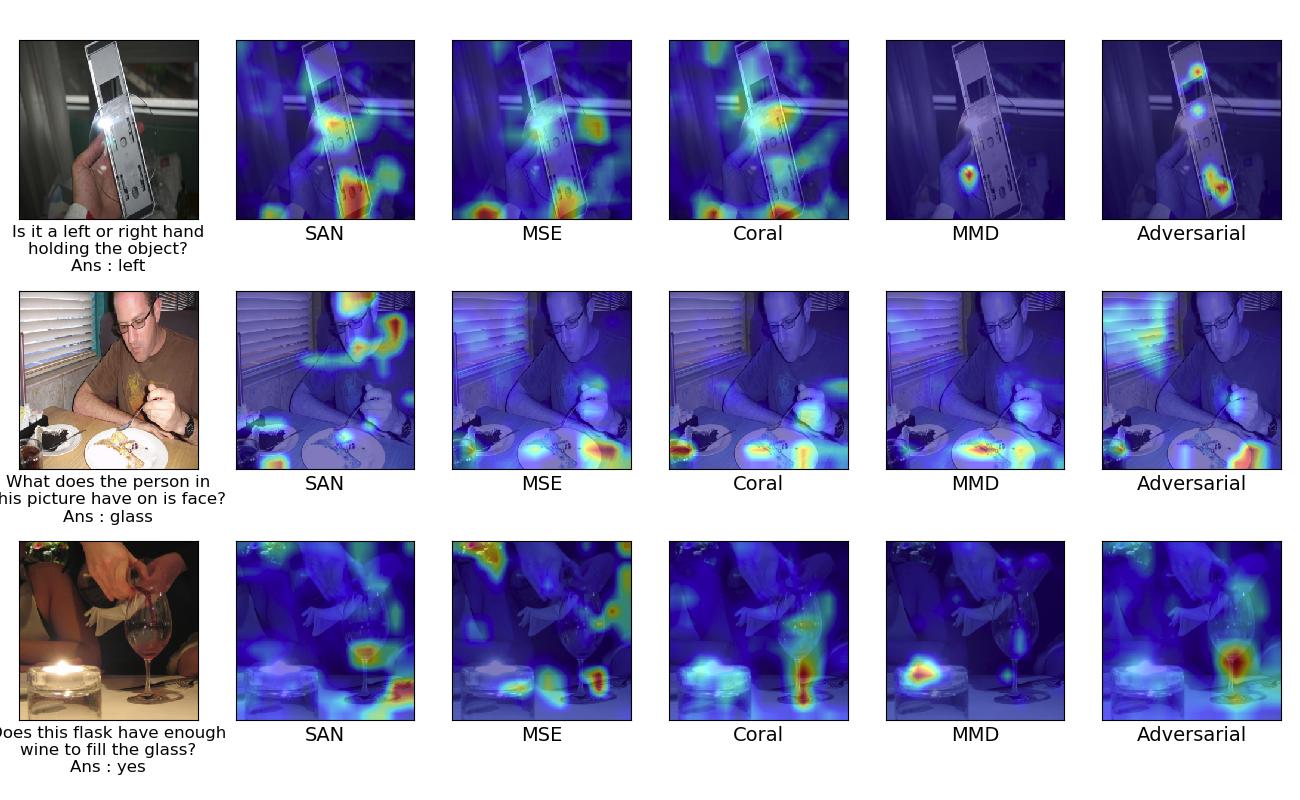
Examples with different approaches in each column for improving attention using explanation in a self supervised manner. The first column indicates the given target image and its question and answer. Starting from second column, it indicates the Grad-CAM map for Stack Attention Network, MSE based approach, Coral based approach, MMD based approach, Adversarial based approach respectively.
Warm-Start model Results:
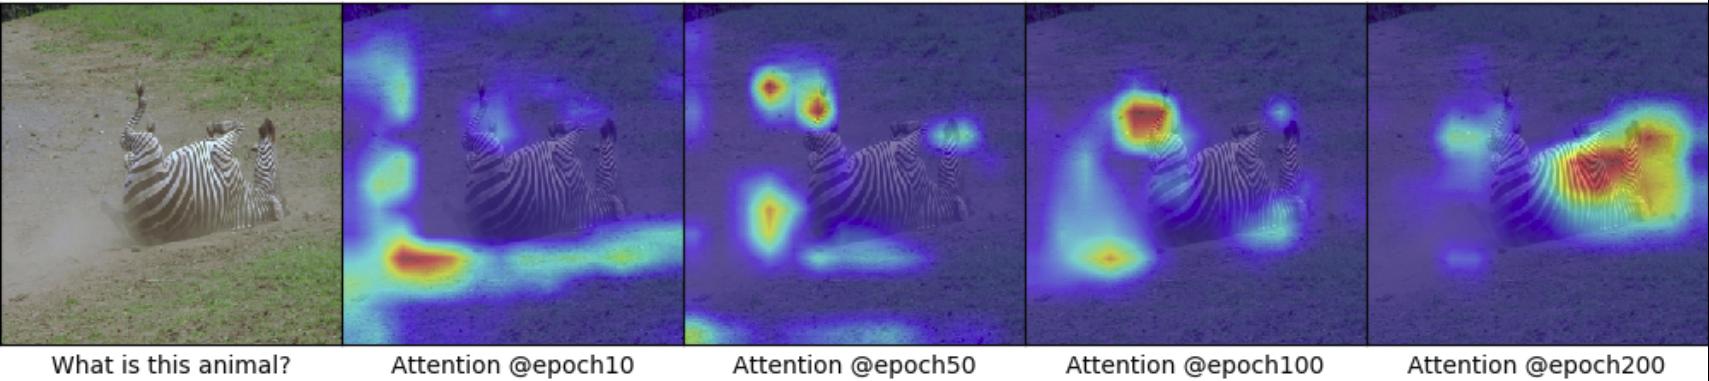
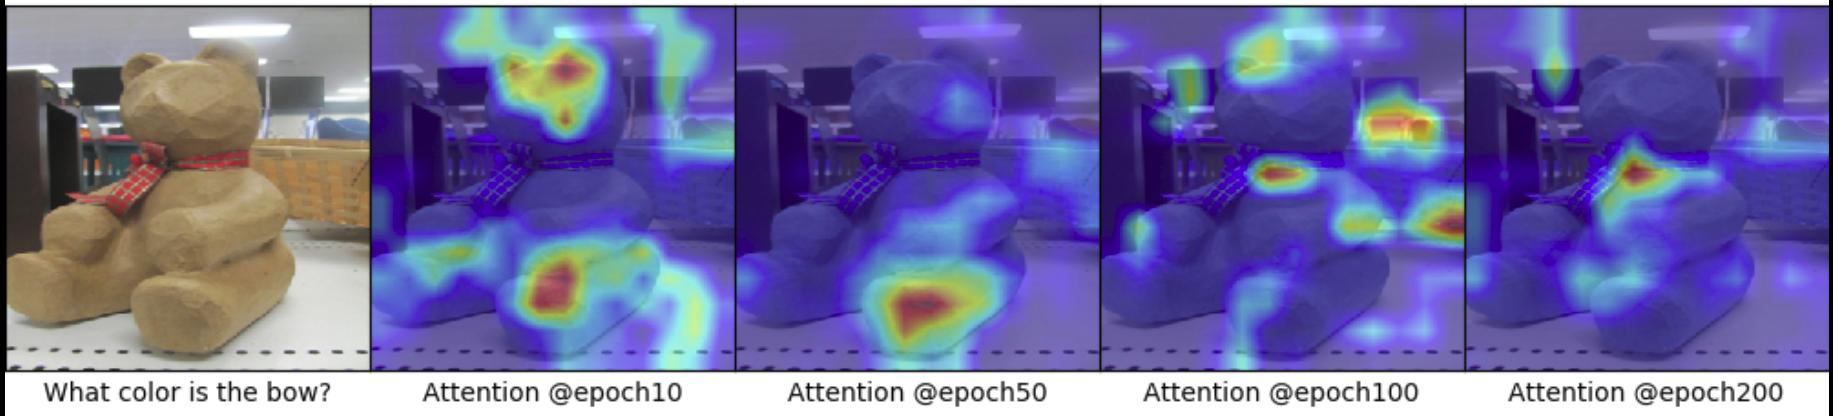
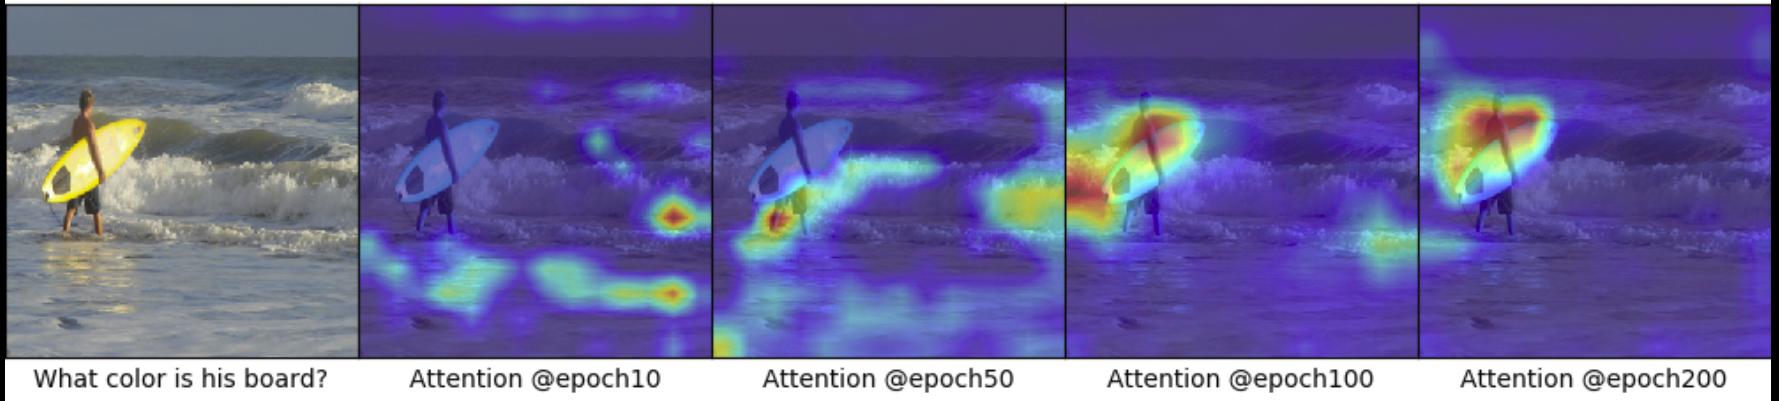
Visualisation of attention map after epoch-10, epoch-50, epoch-100, epoch-200.
Statistical Significance Analysis:
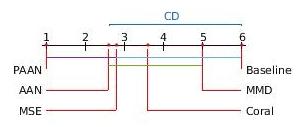
The mean rank of all the models on the basis of all scores are plotted on the x- axis. CD=3.3722, p=0.0003461. Here our PAAN model and others variants are described in section-4.1 of the main paper. The colored lines between the two models represents that these models are not significantly different from each other.
Visual Dialog Results for PAAN model:
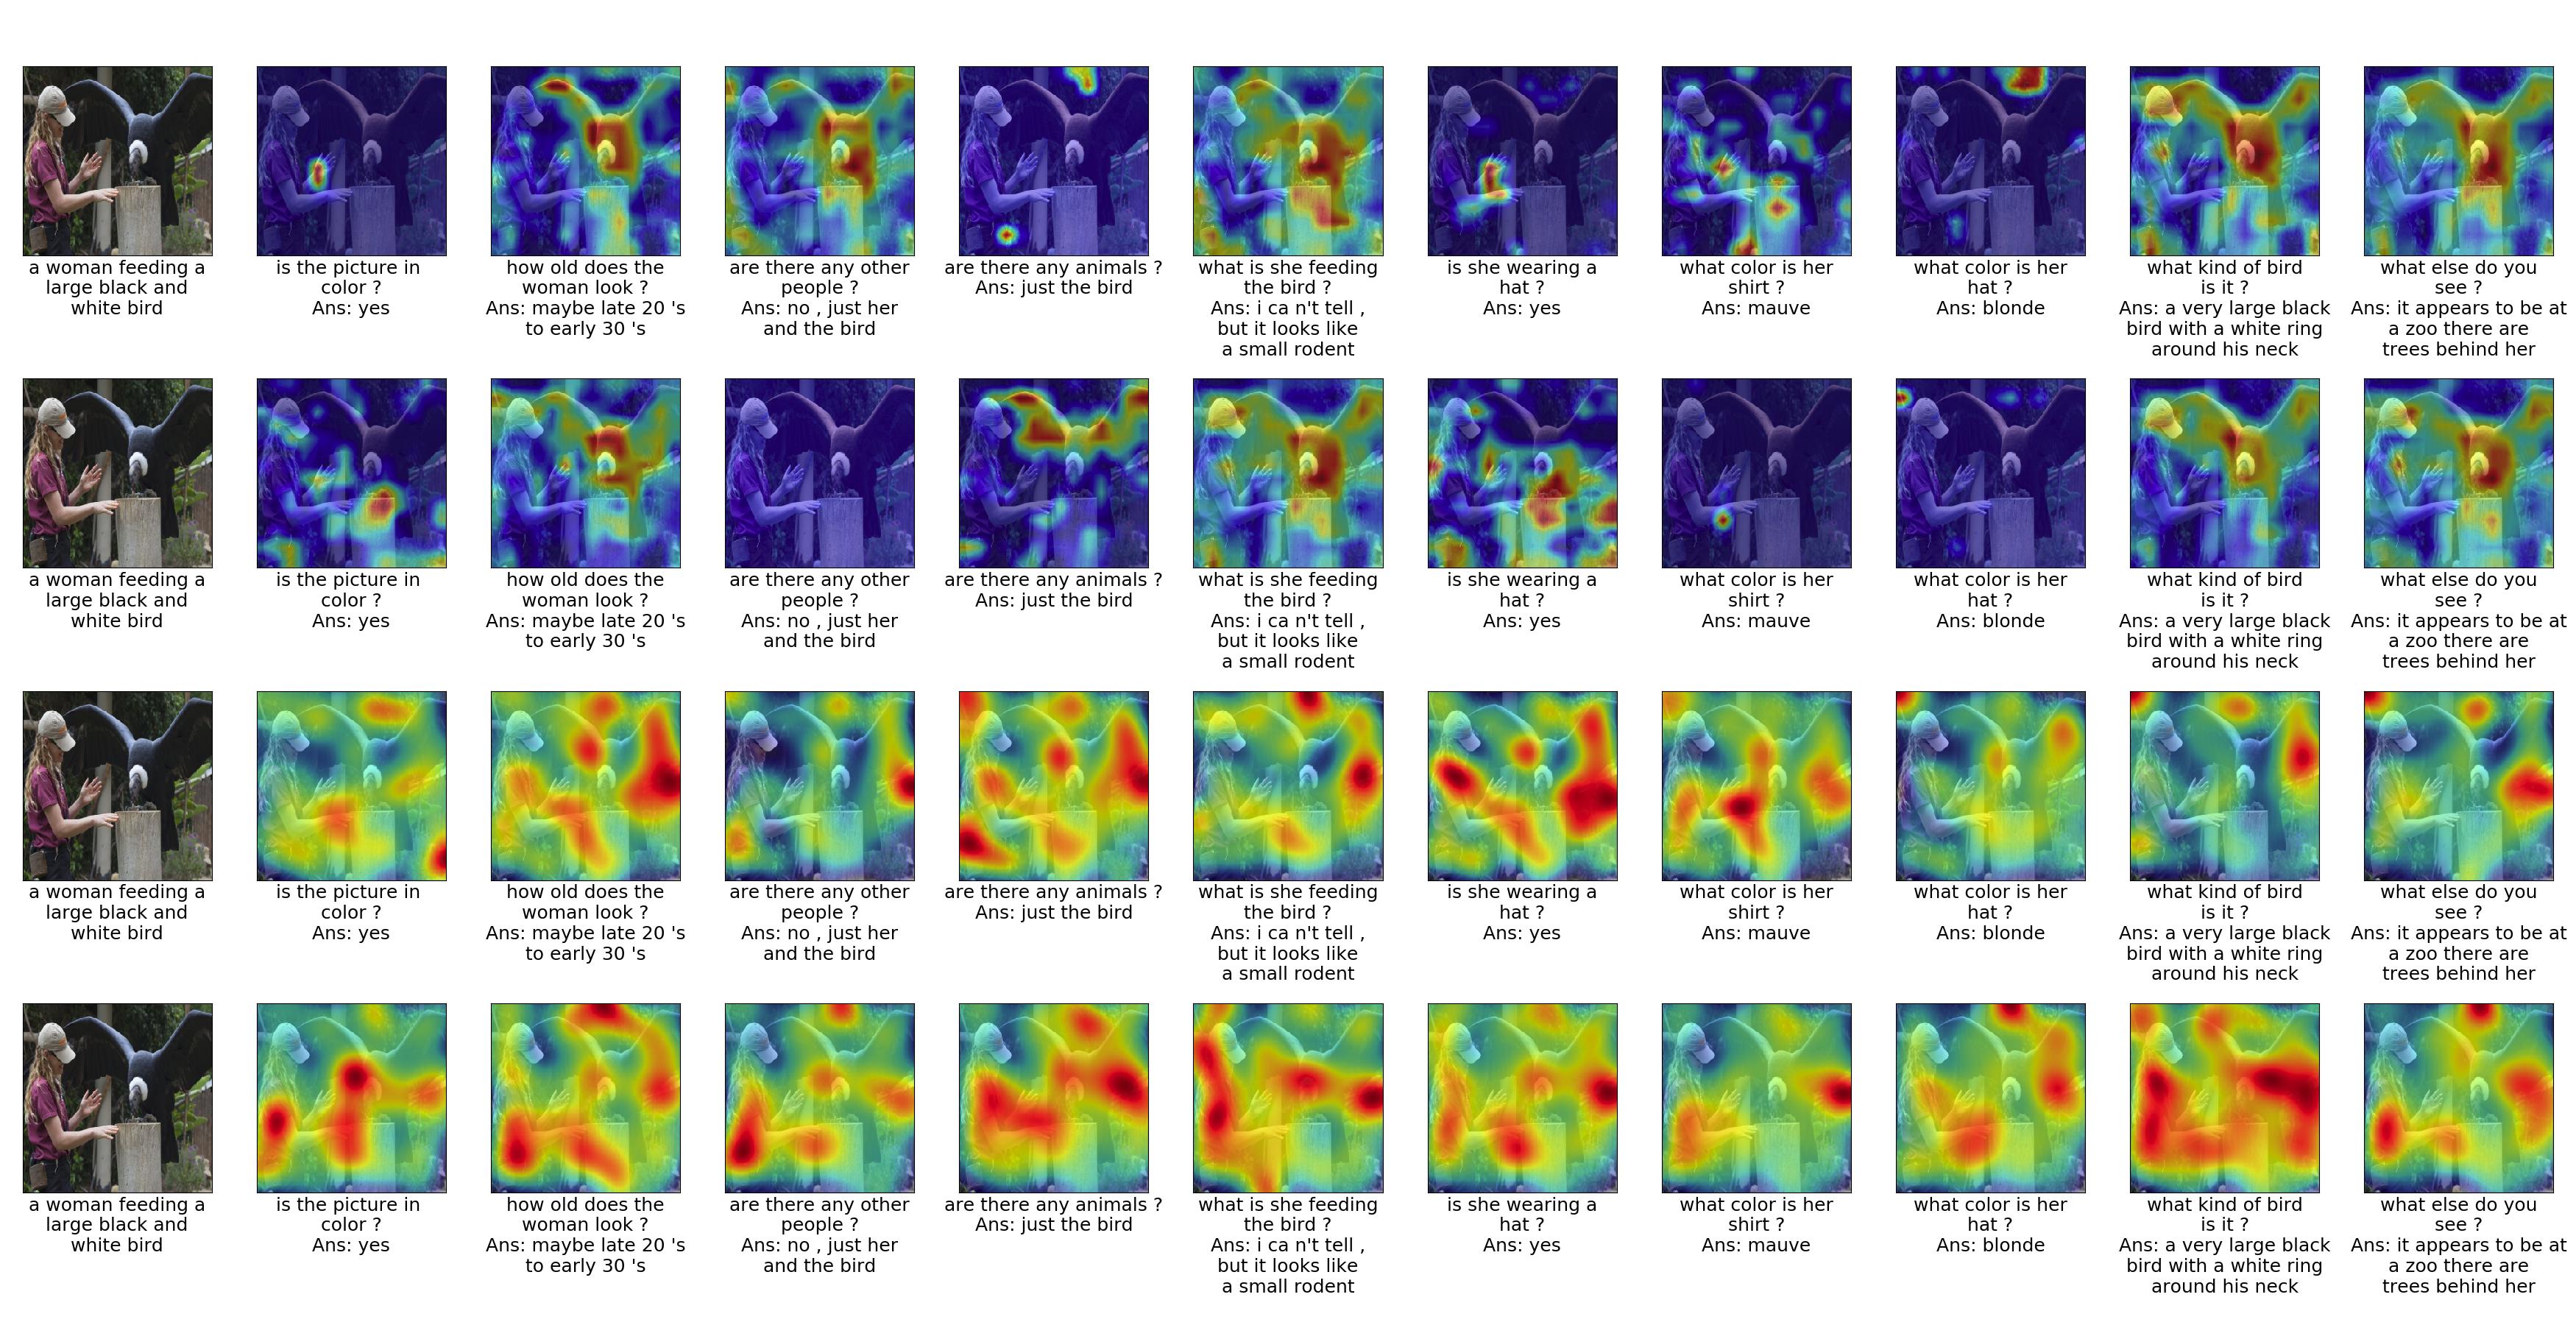
This figure shows visual explanation and attention map for Visual Dialog task. The first row contains grad cam results and second contains attention results for Adversarial approaches. We have shown all the dialog turns present in the dataset.
Attention map Variance :
Variance in attention map for the same question to the image and its composite image in VQA2.0 dataset.
Dataset Details
VQA-V1:
It contains human annotated question-answer pairs based on images (MS-COCO dataset's images).
| Field | Train | Val | Test |
|---|---|---|---|
| Q-A pairs | 2,48,349 | 1,21,512 | 2,44,302 |
VQA-V2:
It has almost twice the number of question-answer pairs as **VQA-V1** and also claims to remove some biases.
| Field | Train | Val | Test |
|---|---|---|---|
| Q-A pairs | 4,43,757 | 2,14,354 | 4,47,793 |
VQA-HAT
Dataset containing human annotated attention maps. (Based on **VQA-V1**).
| Field | Train (out of 2,48,349) | Val (out of 1,21,512) |
|---|---|---|
| Q-A pairs | 58,475 | 1,374 |
BibTex
@InProceedings{Patro_2020_AAAI,
author = {Patro, Badri N. and Anupriy and Namboodiri, Vinay P.},
title = {Explanation vs Attention: A Two-Player Game to Obtain Attention for VQA},
booktitle = {AAAI},
year = {2020}
}
Acknowledgement
We acknowledge the help provided by Delta Lab members, who have supported us for this research activity.
-------------------------------------------------------------------------------------------------------------------------------------------